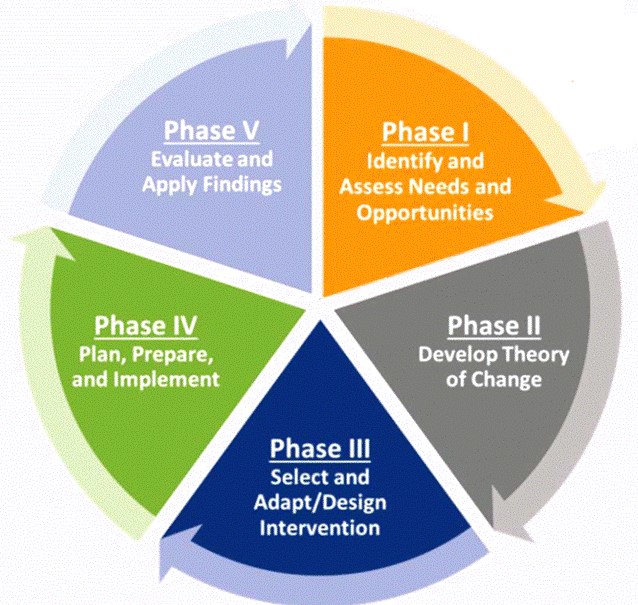
Phase 1: Identify and Assess Needs
Milestones: Identify need, Form Team(s), Explore Problem in Depth (using data)
Identify Need:
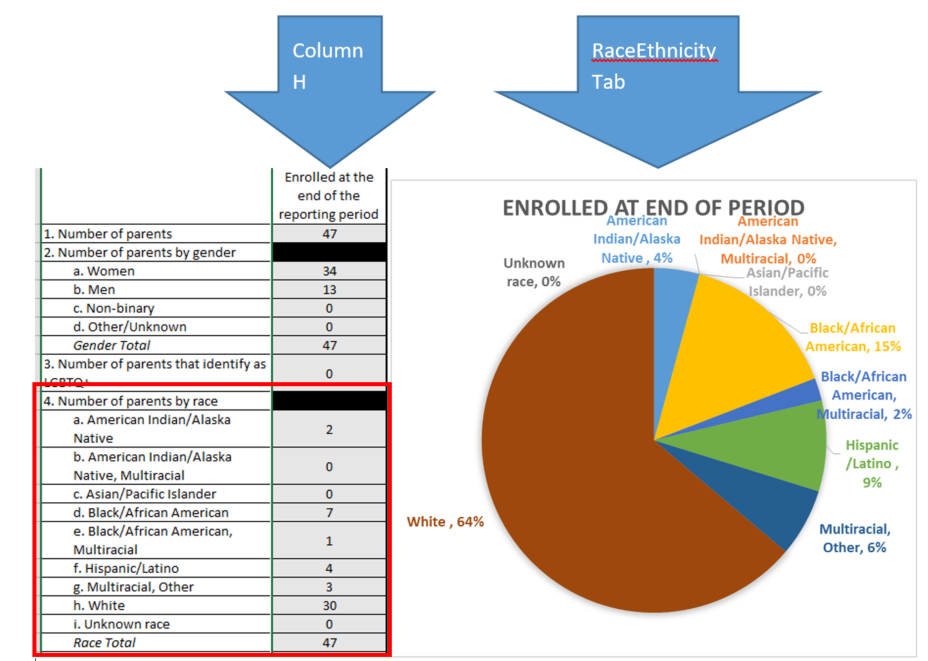
In this example: Reviewing the WA Performance Reporting Form has raised the following concern: The race breakdown of parents currently enrolled (Column H, tab RaceEthnicity) is mostly White. Other identified race or ethnicity markers are not as high as the population we think we see in our non-FTC dependency court demographics (we will need to check this anecdotal piece for accuracy).
In this example: We identified our goal, which is to increase the participation of BIPoC (Black, Indigenous, and People of Color) families in our FTC.
Form a team:
Your existing FTC Community Action Team, Oversite Committee, Steering Committee, or Community Stakeholders are all places to look for team members depending on your county infrastructure.
Questions to ask:
- What is the goal of the team?
- What expertise is required?
- How will decisions be made?
- Do these team members have the power to enact the change that is deemed necessary?
In this example: Our county formed a committee from members of our oversite committee and local Community Action Team. This new committee is made up of: of the FTC coordinator, the Judicial Officer, the Executive Director of our primary SUD treatment site, the DCYF Social Work Supervisor, and a Tribal Member who is involved in the Healing to Wellness Court in our local area
Explore the Problem in Depth:
Questions to ask:
- Is this representative of the population involved in the child welfare system in our county?
- Is this representative of the population as a whole in our county?
- How are we measuring race/ethnicity? Are we measuring in the best way we can?
Places to look for answers:
This NEFTC Self-Led Worksheet will help your team self-evaluate best on best practices.
This publication by the Children Bureau (2021) looks at racial disproportionality, root causes, and suggests solutions.
- Yearly Dependency Timeliness Report (DTR) and/or the Interactive Dependency Dashboard: DependencyDashboard | Tableau Public
-
-
- Using the DTR, we see that the state demographics for 2020 indicate that 50% of children involved in the WA dependency cases are White and 16% are Hispanic. Because the race breakdown in our example shows that 64% of parents in the program are White and 9% are Hispanic, it looks like White parents are overrepresented in our example program and at least Hispanic parents are underrepresented in our example program.
-
- Washington Office of Financial Management population estimates Estimates of April 1 population by age, sex, race and Hispanic origin | Office of Financial Management (wa.gov)
- Based on the 2020 census, 64% of Washington’s population identifies as Non-Hispanic White; this is similar to our example program participants. Based on the 2020 census 14% of Washington’s population identifies as having Hispanic origin. This is also higher than our example program participants again suggesting we are underserving Hispanic/Latino parents.
- We also, as a committee, reviewed team data collection processes to
- Find out if parents are allowed and able to self-identify their race when enrolling in the program. Staff should not assume or guess a parent’s race.
In this example: We collected data from all of the above sources and put together a brief summary in addition to the performance measures. This report is distributed to all the members of our team and any additional stakeholders that might be able to assist with our efforts.
Conclusions to Phase 1
- Based on the reliable information our team collected, using evidence gathered at the state and local level, our team has identified and documented a need:
- The dependency cases as a whole underrepresent White families, which means families of color are overrepresented in the dependency system. White families are then overrepresented in our example program, and families of color are underrepresented in our example program.
- We formed a team that is able to make decisions and enact change.
- We identified an outcome we would like to see occur: In a period of one year starting Jan 2022 and ending Dec 2022, we will increase the participation of BIPoC families in our FTC.